
Cross-Platform Ad Measurement That Actually Works: A Practical Framework For Google, Microsoft, Meta, And Amazon
If you’re advertising across Google, Microsoft, Meta, and Amazon, platform dashboards will all claim they “won.” This editorial lays out a practical, SME-friendly measurement framework—tracking validation, overlap management, attribution windows, incrementality thinking, and CRM feedback—so you can compare performance fairly and make budget decisions with confidence.

Advertising across Google, Microsoft, Meta, and Amazon is no longer a “big brand only” strategy. For many small and mid-sized businesses, it’s the default: search for intent capture, social for demand creation, marketplaces for ready-to-buy shoppers, and retargeting everywhere.
The catch: every platform’s dashboard will tell you it drove the conversion. If you take each report at face value, you don’t get insight—you get a budget argument.
This editorial is my practical, operator-first framework for measuring campaign success across multiple ad ecosystems fairly. It’s based on the measurement principles discussed in Search Engine Journal’s Ask a PPC column on cross-platform measurement, but expanded into a full, standalone playbook you can implement with a small team and imperfect data.
We’ll cover what changed in measurement, why it matters now, what can go wrong, what SMEs should monitor, what agencies should rethink, and where execution (not just reporting) determines whether your numbers mean anything.
Concise summary

- Start with trust: validate Conversion tracking per platform, then validate against independent signals (analytics + CRM + human feedback).
- Expect overlap: multiple platforms taking credit is normal in multi-touch journeys. Treat overlap as a signal, not an error—then manage it with clear rules.
- Normalize or you’ll mislead yourself: define common KPIs (qualified actions, new customers, margin-aware value) and compare platforms using the same definitions.
- Attribution windows are a business decision: set windows based on buying cycles, not defaults. Align them across platforms where possible.
- Early stage = learning: before you obsess over “which platform won,” confirm audience fit, message resonance, and creative quality.
- AYSA’s angle: measurement improves when the website and content are consistent, crawlable, fast, and instrumented. AYSA helps monitor, propose fixes, request approval, and execute accepted changes (so measurement isn’t stuck in dashboards).
Table of contents

- What changed: why cross-platform measurement is harder now
- The real problem: platform truth vs. business truth
- Step 1 — Build a measurement “kernel” before you touch attribution
- Step 2 — Validate tracking like you’ll be audited
- Step 3 — Assume overlap: design for it, then quantify it
- Step 4 — Normalize metrics so you’re comparing like with like
- Step 5 — Set attribution windows based on buying reality (not defaults)
- Step 6 — When it doesn’t matter where the conversion came from
- Step 7 — When attribution becomes critical
- Step 8 — Add human feedback and CRM reality checks
- A concrete SME scenario: the multi-channel orthodontic clinic
- What agencies should rethink in 2026
- Where AYSA fits: measurement is an execution problem
- What to do next: a prioritized action list
- Sources and further reading
What changed: why cross-platform measurement is harder now
Cross-platform measurement has always been messy. What’s different now is that the mess has consequences:
- Automation needs clean inputs. Smart bidding and conversion-based optimization can scale fast—but they can also amplify bad tracking.
- Brand and performance are collapsing into one system. The line between “awareness” and “conversion” is thinner than it used to be, and your reporting has to reflect that blended reality.
- Journeys are multi-touch by default. A user may discover you on social, compare on search, read reviews, and buy on a marketplace—or the reverse.
- Closed ecosystems exist alongside open web behaviors. Amazon often keeps the conversion inside Amazon; search and social send traffic out; your CRM may be the only place revenue truth exists for lead gen.
That’s why “just look at ROAS by platform” isn’t a strategy. It’s a shortcut to reallocating budget away from the channels doing the hardest job (creating demand) toward the channels that harvest it (capturing intent).
The Search Engine Journal piece that inspired this framework asks a simple question—how to compare platforms fairly—and correctly starts with foundational tracking trust before talking attribution. Read the original here: Search Engine Journal — How Do I Effectively Measure Campaign Success Across Multiple Platforms? (Ask a PPC).
The real problem: platform truth vs. business truth
Every ad platform is incentivized to:
- maximize the conversions it can claim, and
- frame performance in ways that justify more spend.
That doesn’t mean platforms are lying. It means they measure from their vantage point, with their own attribution rules, identity graphs, and reporting constraints.
Business truth is different. Business truth is:
- How many qualified leads or purchases happened?
- How many were new customers?
- What did those conversions yield in margin and cash flow?
- What did we learn that changes next month’s plan?
If your reporting can’t answer those questions consistently across platforms, you don’t have measurement—you have competing narratives.
Step 1 — Build a measurement “kernel” before you touch attribution
The fastest way to get cross-platform clarity is to create a small set of definitions and systems that every platform must map to. I call this the measurement kernel.
1) Define outcomes in business language (not platform language)
Create a short list of outcomes your business cares about. For most SMEs, it’s one of these two families:
- Ecommerce: purchase, first purchase, subscription start, high-margin product purchase.
- Lead gen: booked appointment, qualified lead, sales-accepted lead, closed-won deal.
Then define “qualified.” A lead is not qualified because a form was submitted. It’s qualified because it meets criteria your sales or operations team actually trusts (service area, budget range, right procedure, right company size, etc.).
2) Map those outcomes to a minimum viable event set
Keep the event set small. The more events you create, the more ways they can break. For example:
- Primary conversion: purchase OR booked appointment OR demo request.
- Secondary (supporting) events: add to cart, begin checkout, call click, form start, pricing page view.
Secondary events are useful—but treat them as signals, not victory laps.
3) Choose your “source of truth” layers
You want at least three layers:
- Platform reporting: what Google/Microsoft/Meta/Amazon say happened.
- Independent analytics: your website analytics and server-side reality where possible.
- Business systems: ecommerce backend or CRM where revenue/qualification is recorded.
The goal isn’t perfect alignment. The goal is to understand where and why they disagree.
4) Set governance: naming, change control, and documentation
Most measurement problems are self-inflicted via untracked changes:
- someone edits a form,
- a thank-you page changes,
- a checkout step gets removed,
- a new subdomain launches,
- a cookie banner configuration changes.
If you run multi-platform spend, you need a lightweight change log. This is where an execution system helps: not “who touched it,” but “what changed, when, and what measurement did it affect.”
Step 2 — Validate tracking like you’ll be audited
The SEJ column starts with a blunt but correct question: do you trust your conversion tracking per platform?
Most teams answer “yes” because conversions show up in the dashboard. That’s not trust—that’s hope.
Use platform diagnostics first (then distrust them)
Start with each platform’s built-in diagnostics to confirm tags/pixels are firing. That’s necessary, but insufficient. A pixel can fire and still be wrong:
- firing on the wrong page,
- firing twice,
- firing without required parameters,
- firing for bot traffic,
- firing for internal staff,
- firing when a modal appears (not when the form submits).
Layered validation: “reported” vs. “observed”
A practical validation routine looks like this:
- Test conversions yourself (with clean notes): run a click, complete the action, record timestamps, device, browser.
- Check real-time analytics to confirm the event appears as expected.
- Confirm the backend reality: did the order appear? did the lead enter the CRM? was it deduped?
- Compare platform timestamps and counts over a week, not a day.
The SEJ column mentions using tools like Microsoft Clarity to confirm real behavior aligns with reported conversions. That’s a good example of validating with an independent lens rather than trusting a single dashboard.
What to do if confidence is low
If you suspect tracking is wrong, your goal is to prevent the worst outcome: smart bidding optimizing toward garbage.
Practical containment steps:
- Run a one-week spot check and document discrepancies (SEJ recommends a spot check window as well).
- Segment by device and landing page to identify where misfires happen.
- Exclude low-confidence periods from internal reporting so you don’t “learn” the wrong lesson.
- Temporarily optimize to a more reliable event (e.g., begin checkout instead of purchase) only if purchase tracking is broken and you must keep spend live.
Don’t “fix measurement” by simply changing attribution models. That’s painting over water damage.
Step 3 — Assume overlap: design for it, then quantify it
Multiple platforms taking credit for the same conversion is not inherently a bug. It’s often a reflection of how people behave across touchpoints.
Why overlap happens
- A user sees a Meta ad (view-through).
- Later searches on Google and Clicks (click-through).
- Gets retargeted on Microsoft inventory.
- Finally buys via Amazon after reading reviews.
Each platform has a plausible story. Your job is to interpret overlap without getting manipulated by it.
Use overlap to your advantage (not just to argue attribution)
The SEJ column makes a strong point: overlap can be used operationally. Examples that work for SMEs:
- Build remarketing audiences earlier in the journey. If some networks offer lower CPC for broad reach, use them to build audiences you can retarget later with higher-intent offers.
- Use path analysis to improve creative. If users often engage on social first, you may need education-led creative there and intent-led creative on search.
The win isn’t “proving” one platform deserves all credit. The win is designing a funnel where each platform does a job you can describe.
Quantify overlap with simple, repeatable checks
You don’t need an enterprise MTA tool to get directional overlap insight. Start with:
- Conversion path reports in your analytics tool (where available) to see common sequences.
- Time-to-convert distributions by channel (how long after first visit do conversions happen?).
- New vs returning visitor splits for each channel landing experience.
Then document “known overlaps” as part of your reporting narrative. Example: “Meta is driving first-touch sessions and list growth; Google is closing with brand + high intent.”
Step 4 — Normalize metrics so you’re comparing like with like
Cross-platform comparisons usually fail because teams compare:
- Google “purchases” vs Meta “conversions” vs Amazon “orders,”
- 7-day click vs 1-day view vs 30-day click windows,
- different definitions of a lead,
- different counting rules (one per click, one per user, one per transaction).
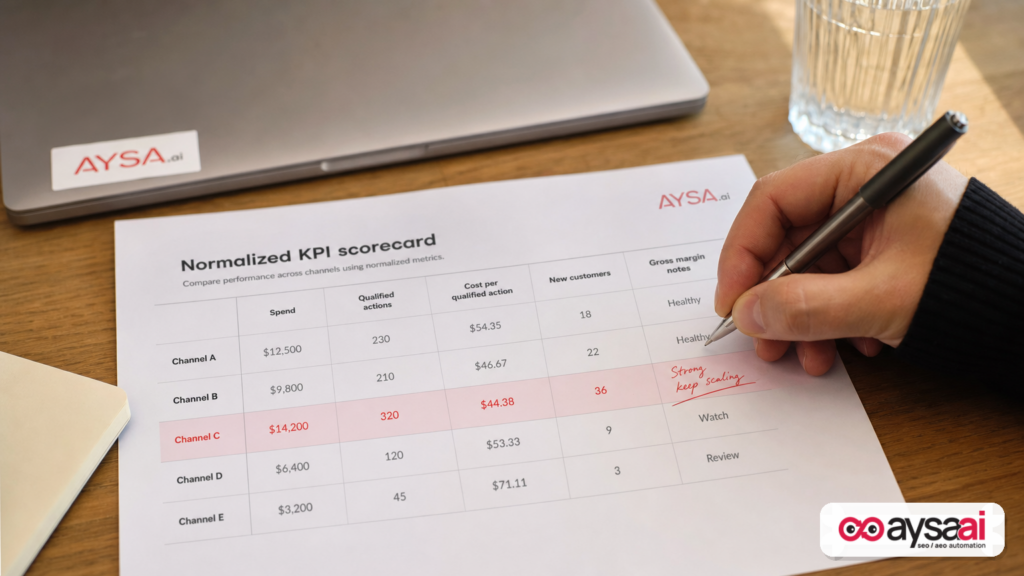
Normalization means building a scorecard where every platform is judged by the same business definitions.
A practical normalized scorecard (ecommerce)
For ecommerce SMEs, consider these columns:
- Spend
- New customers (from backend/CRM if possible)
- Gross margin estimate (even a rough product-level margin band is better than none)
- Cost per new customer
- Blended MER (marketing efficiency ratio) at the business level (use cautiously; definitions vary)
- Assist signals: engaged sessions, email signups, add-to-cart rate (supporting, not deciding)
If you can’t reliably identify new customers, say so. Then focus on qualified revenue and repeatable cohorts.
A practical normalized scorecard (lead gen)
For lead gen, especially local services and B2B:
- Spend
- Leads (platform)
- Qualified leads (CRM)
- Booked appointments / sales accepted (CRM)
- Close rate (where available)
- Cost per qualified lead and cost per booked
- Speed-to-lead (time from inquiry to contact)
This is where many teams discover the uncomfortable truth: the “best CPA” platform sometimes produces the worst sales outcomes.
Create a translation layer: platform events → business outcomes
Write a one-page mapping that everyone agrees on. Example:
- Platform “Lead” = form submit
- Business “Qualified lead” = form submit + within service area + valid phone + needs service within 30 days
- Business “Booked” = appointment scheduled in system
Then report both levels side by side. This defuses arguments and forces operational focus.
Step 5 — Set attribution windows based on buying reality (not defaults)
The SEJ column highlights an area most teams underthink: conversion windows and view-through windows.
Attribution windows are not “settings.” They are your measurement policy for how long marketing influence should be considered plausible.
How to set windows without pretending you have certainty
Use your observed buying cycle signals:
- Ecommerce with impulse buys: shorter windows often reflect reality, but remarketing can still matter.
- Considered purchases (high AOV, specialized products): longer windows may be necessary to capture research behavior.
- B2B lead gen: long cycles mean last-click is often a lie. You need CRM stages to understand impact.
If you can’t calculate cycle length, start with a conservative assumption, then revisit after 30–60 days of data.
Align windows across platforms where possible
Perfect alignment may not be possible due to platform constraints, but alignment is still the goal. Why?
- Different windows create different winners.
- Different windows make trend analysis unstable.
- Different windows make “budget optimization” feel scientific when it’s mostly settings-driven.
Document your chosen windows in your measurement kernel and treat changes as major reporting events.
View-through: use it to understand halo, not to claim victory
View-through can reveal the “halo effect” of Impressions (the SEJ piece calls this out). It’s useful when treated as a directional indicator:
- Did reach increase alongside Branded Search?
- Did returning visitors rise after a new creative launch?
- Did direct traffic patterns shift?
But don’t use view-through to justify spend without corroboration from independent signals.
Step 6 — When it doesn’t matter where the conversion came from
This is one of the most important mindset shifts in the SEJ column: early on, precise attribution isn’t always the priority. Exploration is.
In early-stage campaigns, measure fit and learning
If you’re launching a new channel (or a new product line), your first job is to answer:
- Are we reaching the right audience?
- Does the message make sense to them?
- Do they engage meaningfully on-site (or on-platform)?
- Does the traffic behave like potential buyers?
That means looking at:
- click-through rate and creative engagement (directional),
- landing page behavior,
- form completion quality,
- product page depth and return visits.
If these are weak, attribution is not your bottleneck—strategy is.
What can go wrong if you obsess over attribution too early
- You kill the channel that creates demand because it looks “expensive.”
- You overfund the channel that captures demand and then wonder why growth stalls.
- You optimize creative for clicks, not for qualified outcomes.
Attribution is a tool. Learning is the objective.
Step 7 — When attribution becomes critical
Attribution becomes more important when:
- you have stable tracking,
- creative is iterating based on evidence,
- you need to make real budget tradeoffs.
Budget allocation: use attribution as one input, not the judge
The SEJ column frames the goal well: it’s not to crown a single winning platform, but to reflect how users move through the funnel.
In practice, budget decisions should consider:
- Incremental lift signals (directional where you can’t fully test),
- capacity constraints (can you fulfill more leads/orders?),
- creative fatigue (is performance dropping due to repetition?),
- organic strength (where paid is redundant vs where it fills a gap).
Note: the SEJ column mentions that strong organic performance may justify reducing paid investment in a channel. That’s often true—but only after you validate that paid isn’t protecting your visibility from competitors on key queries or audiences.
Special case: closed ecosystems (Amazon and similar)
Marketplaces can be their own universe:
- They may capture conversion data well inside their walls.
- They may limit the granularity of off-platform behavior.
- They can still be influenced by off-platform demand creation.
So your question becomes: “Does our off-Amazon marketing increase Amazon demand?” You may not be able to prove it perfectly with platform dashboards alone. You’ll need a blend of timing analysis, brand query trends, and business-side sales patterns.
Step 8 — Add human feedback and CRM reality checks
One of the most undervalued ideas in the SEJ article is also the most practical: incorporate human feedback.
Ask customers how they found you. Ask sales what leads are saying. Ask support what new customers mention.
This is not “unscientific.” It’s an independent measurement layer that often catches what pixels can’t.
What human feedback reveals that dashboards miss
- Perception gaps: the platform credited the conversion, but the customer remembers discovering you somewhere else.
- Message interpretation: customers repeat a phrase from a video ad that never gets last-click credit.
- Lead quality clues: “I thought you offered X” suggests mismatch between creative promise and landing page reality.
How to operationalize feedback (without turning it into chaos)
- Standardize “How did you hear about us?” as a CRM field or checkout survey.
- Train teams on dropdown discipline (free-text becomes unusable fast).
- Review it monthly alongside platform reporting.
The SEJ column recommends aligning sales and marketing on lead attribution standards. In SMEs, this is often the difference between scaling and spinning.
A concrete SME scenario: the multi-channel orthodontic clinic
Let’s make this real.
Business: a multi-location orthodontic clinic with:
- Google Ads for “braces near me” and “Invisalign” queries,
- Meta ads for parent-targeted awareness and offers,
- Microsoft Ads to pick up lower-cost Search volume,
- remarketing across platforms.
What goes wrong with naive measurement
- Meta reports lots of conversions (some are view-through).
- Google reports fewer conversions but “higher intent.”
- Microsoft reports “efficient CPA.”
- The front desk says, “We’re getting more calls, but many are out of area.”
Leadership asks: “Which platform should we cut?”
Applying the framework
Step A: Define outcomes. Primary conversion is booked consultation, not form submits.
Step B: Validate tracking. A spot check reveals the form submit event fires twice when users correct an error. Platforms inflate conversions. Smart bidding “learns” the wrong behavior.
Step C: Normalize. Build a scorecard that includes:
- platform leads,
- CRM-qualified leads (in service area),
- booked consults,
- show-up rate (if available).
Step D: Use overlap. The clinic notices many booked consults have a first touch from Meta and last click from Google brand search. Instead of arguing, they decide:
- Meta creative focuses on education and trust,
- search ads focus on location, availability, and financing,
- landing pages match the message and include service-area clarity.
Step E: Add human feedback. The intake form includes “How did you hear about us?” with dropdown options. Over 60 days, the clinic learns that many “Google” patients mention a video they saw first—meaning Meta is influencing even when it doesn’t get last-click credit (directional, not absolute).
The outcome that matters
The clinic doesn’t “pick a winner.” It:
- fixes tracking so automation stops optimizing to noise,
- measures booked consults as the primary KPI,
- allocates budget based on qualified bookings and capacity,
- improves creative-to-landing alignment to raise conversion quality.
What agencies should rethink in 2026
If you’re an agency (or an in-house team operating like one), cross-platform measurement is now part of your product. Not an add-on.
1) Stop treating platform dashboards as the final word
Dashboards are inputs. Your deliverable is an interpretation tied to business outcomes.
2) Build measurement governance into onboarding
In your first 30 days, you should deliver:
- a measurement kernel (definitions + event map),
- a tracking validation report,
- a change log process,
- a normalized scorecard template.
3) Treat creative and landing pages as measurement variables
Bad creative can look like a tracking issue. Bad landing pages can look like “the channel is expensive.” Measurement and CRO are not separate if you want honest comparisons.
4) Integrate sales feedback loops
Lead gen agencies that don’t speak to sales outcomes will get replaced by agencies that do. Simple as that.
Where AYSA fits: measurement is an execution problem
Cross-platform measurement breaks most often at the website layer:
- events misfire because templates change,
- conversion pages get redesigned without tracking updates,
- content doesn’t match ad promise, reducing qualified Conversion rate,
- site speed and UX issues distort channel comparisons,
- organic gaps force paid to do more than it should.
That’s why I see measurement as an execution discipline, not a reporting discipline.
AYSA is built to help teams close that loop:
- Monitor site changes and visibility signals continuously (AYSA Monitoring).
- Prepare prioritized fixes and content improvements tied to outcomes like qualified traffic and conversion readiness (AI SEO tools).
- Ask for approval before making changes—so marketers, founders, and agencies keep control.
- Execute accepted website changes to reduce measurement drift and improve on-site conversion performance.
- Support AI-era visibility so organic can carry more load over time (AI Search Visibility).
If you’re paying for clicks across multiple platforms, you’re effectively renting demand. Your website and organic presence are your long-term compounding assets. Measurement should reflect both realities, and execution should reinforce them.
To explore whether AYSA fits your team size and workflow, see pricing and the latest implementations and frameworks on the AYSA blog.
What to do next: a prioritized action list
If you do nothing else this month, do these in order:
- Write your measurement kernel (one page): primary conversion, qualification definition, supporting events, and your source-of-truth layers.
- Run a tracking audit sprint (one week): test conversions, dedupe issues, confirm backend reality, and document discrepancies.
- Normalize your scorecard: compare platforms on qualified outcomes, not raw platform conversions.
- Document attribution windows: choose windows based on buying cycle and align them where feasible.
- Add one human-feedback mechanism: a standardized “how did you hear about us?” field or post-purchase survey question tied back to reporting.
- Create a monthly overlap narrative: one paragraph describing how platforms work together in your funnel, with one action you’ll take (creative, landing page, targeting, budget shift).
- Fix the website issues that distort measurement: inconsistent landing experiences, slow pages, unclear offers, broken forms—then re-measure.
Sources and further reading
- Search Engine Journal (Ask a PPC): How to measure campaign success across multiple platforms
- Search Engine Journal: PPC News (context on ongoing paid media changes)
- Search Engine Journal: SEO News (context on search ecosystem changes that impact demand capture)
Note: The source article references concepts like platform diagnostics, attribution models, conversion windows, and tools such as Microsoft Clarity. This editorial intentionally avoids adding “official documentation” links that were not present in the supplied research context. If you want, I can add a vetted documentation appendix (Google Ads / Meta / Microsoft / Amazon / analytics) once you provide the preferred official references your team uses.
Featured image & inline images: Use the prompts above to generate original visuals. Do not use platform screenshots or third-party logos; keep visuals human-centered and focused on decision-making and process.
Continue the AI search topic inside AYSA.
Use these pages to connect the article with AI SEO tools, AI visibility monitoring, AI Overviews and approved website execution.
Turn this topic into a website action plan.
Use these AYSA hubs to move from reading to technical fixes, AI visibility monitoring, research, glossary context and approval-first SEO execution.