
Google Trends’ New “Previous Period” Comparison: How to Turn a Small UI Change Into Better SEO, Demand Forecasting, and AI Search Visibility
Google Trends can now overlay a previous time period line with one click. That sounds minor—until you use it to separate seasonality from real demand shifts, spot competitor moves earlier, and plan content that performs in both classic search and AI-driven discovery.

Google Trends just got a small—but genuinely useful—upgrade: you can now overlay a previous time period comparison line directly on the same chart with a click. This was reported by Search Engine Land, and Google described the change as a faster way to compare a trend against preceding periods from inside Trends.
In isolation, it’s “just” a UI improvement. In practice, this is one of those changes that can meaningfully improve how businesses interpret demand, plan content, and avoid bad decisions—especially for SMEs who don’t have a data team cleaning and blending datasets every week.
At AYSA.ai, we care about upgrades like this because they shorten the distance between a question and a decision: “Is demand up, down, or simply behaving like it always does?” And once you know the answer, your advantage comes from execution—shipping the right site and content changes quickly, with approvals and safeguards.
Concise summary
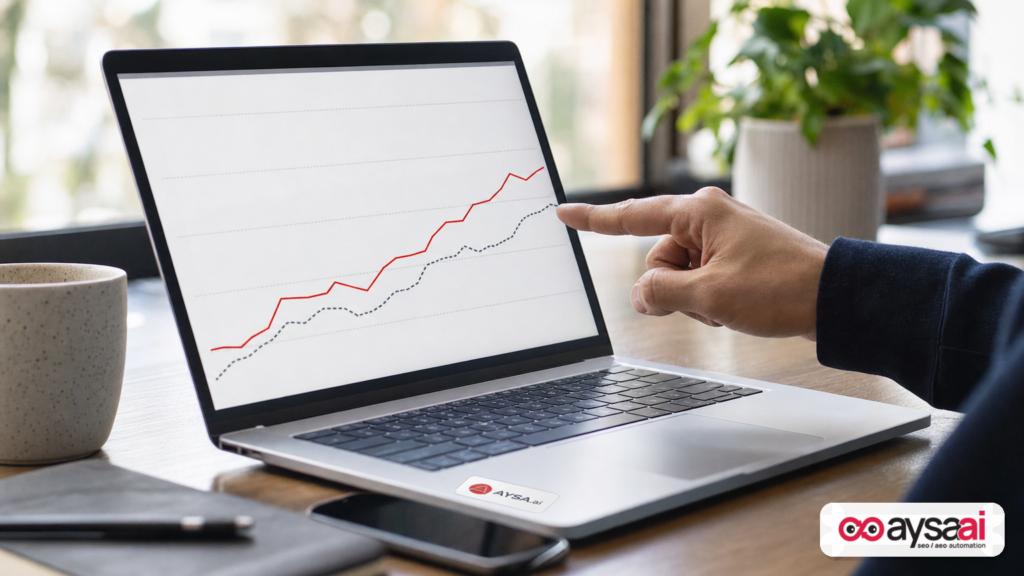
- What changed: Google Trends now lets you add a previous time period comparison line (via new controls above the timeline) to visualize MoM, WoW, and YoY-style context without extra steps.
- Why it matters: You can separate seasonality from true demand shifts faster, which improves forecasting, content planning, and “is this real?” diagnosis when traffic moves.
- What to do: Standardize a “comparison habit” (previous period + YoY), pair it with first-party analytics, and translate insights into an execution queue.
- Where AYSA fits: AYSA helps monitor changes, prepare recommended site/content updates, request approval, and execute accepted changes—turning Trends insights into shipped improvements.
Table of contents

- What changed in Google Trends (and what didn’t)
- Why this matters now (even more than it would have 3 years ago)
- The real value: separating seasonality from signals
- A quick, practical primer: what Google Trends can and cannot tell you
- Use cases that get better immediately with previous-period overlays
- A practical workflow: from Trends insight to approved execution
- SME scenario: a local clinic that thinks demand is down (but it’s not)
- What agencies should rethink: reporting, pacing, and proactive strategy
- How this connects to AI search visibility (AEO/GEO) without overhyping it
- What can go wrong: the common traps when interpreting Trends
- A 30-day action plan for SMEs
- The AYSA perspective: analytics is only useful when it ships
- What to do next
- Sources and further reading
What changed in Google Trends (and what didn’t)
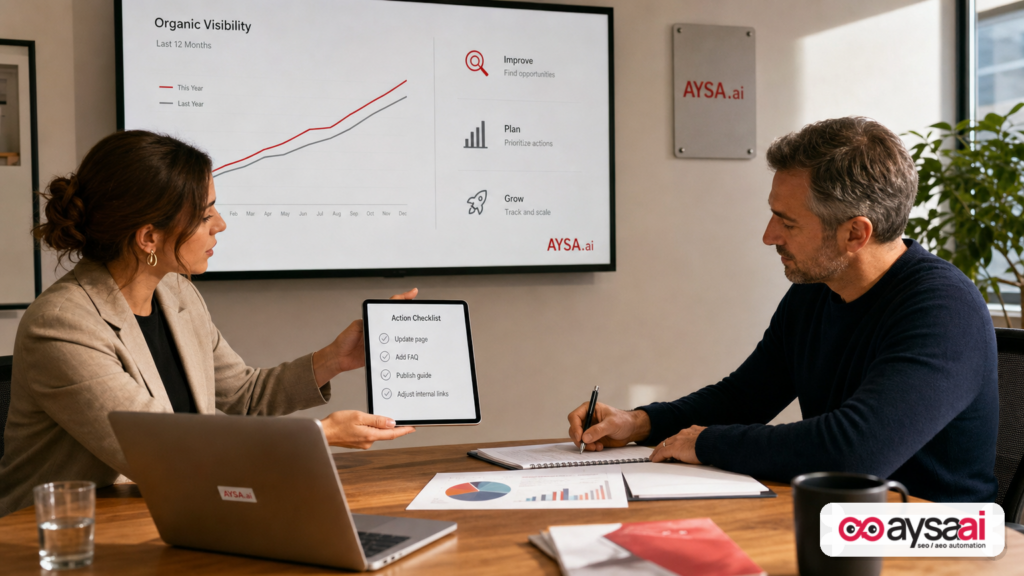
Google Trends has always been a fast way to sense direction: is interest rising, stable, or falling? The friction was comparative context—especially for non-analysts. If you wanted to compare “this month” to “last month” (or “this week” to “last week”), you typically had to:
- Change date ranges manually and remember what the chart looked like, or
- Export, recreate, and overlay comparisons elsewhere (Sheets, Looker Studio, internal dashboards), or
- Run multiple searches and mentally normalize them.
Now Google Trends can surface a comparison line against preceding periods directly in the chart using “chips” (quick controls) above the timeline. Search Engine Land describes it as an instant overlay to show previous time period comparisons, including percentage changes for different windows.
What didn’t change: Google Trends is still primarily a relative index of interest (not a direct “Search volume” report), and it still requires judgment. The improvement is speed and clarity—two things that matter a lot when you’re making weekly content and campaign decisions.
Why this matters now (even more than it would have 3 years ago)
Even without getting dramatic about “the future of search,” the operating reality for most businesses is more complex than it used to be:
- Organic traffic can fluctuate for reasons unrelated to your site quality: SERP layout changes, more ads, more shopping modules, more answer surfaces, and rising “no-click” behaviors.
- Demand itself has become more volatile. Social platforms can create spikes overnight. News cycles compress. Macro uncertainty affects categories quickly.
- Teams are expected to move faster with fewer people.
In that environment, the most expensive mistake is not “missing a trend.” It’s misdiagnosing what happened and reacting poorly: cutting budgets, firing an agency, pausing content, or changing a website based on noise.
A previous-period overlay doesn’t solve everything. But it makes one critical question easier to answer:
“Is this movement abnormal, or is it the same pattern as the prior period?”
The real value: separating seasonality from signals
Seasonality is not just “holiday spikes.” It shows up in almost every category:
- Local services: HVAC, plumbing, roofing, landscaping, pest control.
- Healthcare: allergy seasons, back-to-school physicals, flu shots.
- Ecommerce: gifting peaks, summer gear, winter gear, clearance cycles.
- B2B: budget cycles, hiring seasons, conference-driven demand.
When you don’t compare properly, seasonality gets mistaken for failure. Or worse: an actual demand shift gets mistaken for “just seasonality.”
What the overlay helps you do:
- Spot divergence early. If this period should track the previous one but it doesn’t, you have a lead worth investigating.
- Pick the right response. Seasonality suggests pacing and planning. Divergence suggests diagnosis and action.
- Communicate clearly. A second line in the same chart can reduce unnecessary internal debates.
As a business operator, you want fewer meetings that end with “We need to look into it.” You want more meetings that end with “We know what happened and what we’re doing next.” This change helps you get there.
A quick, practical primer: what Google Trends can and cannot tell you
Before we get tactical, we need to avoid the #1 misuse of Google Trends: treating it like a Keyword volume tool.
What Google Trends is good for
- Directionality: Up, down, flat—especially across time.
- Seasonal patterns: Whether a topic reliably rises in certain weeks or months.
- Comparisons: Term A vs Term B to sense relative interest.
- GEO differences: Where interest is concentrated.
- Topic discovery: Related queries and breakout terms (as leads, not gospel).
What Google Trends is not
- Not absolute search volume. The index is normalized.
- Not conversion intent. Rising interest doesn’t always mean buyers are ready.
- Not your analytics. It does not know your rankings, CTR, brand strength, or site issues.
This distinction matters because the previous-period overlay can make a chart feel more “financial” and precise than it is. It’s still a directional lens—but a better one.
Use cases that get better immediately with previous-period overlays
Here are practical, business-friendly use cases where this upgrade can improve decisions quickly.
1) Content planning that matches the actual demand curve
Most businesses publish content when they have time, not when demand peaks. That’s understandable—until you realize how much revenue is tied to timing.
With a previous-period line: You can see whether the ramp is starting earlier than last period. If so, you publish earlier. If the ramp is late, you avoid rushing and focus on refreshes and Internal linking until demand arrives.
What to do:
- Pick 10–30 “money topics” (products, services, high-margin categories).
- Check their trend curves and compare to the previous period.
- Build an editorial calendar that starts ahead of the ramp, not after the peak.
2) Diagnosing “traffic drops” faster (demand vs visibility)
When traffic drops, there are only a few root causes:
- Demand dropped (fewer people searching).
- Visibility dropped (rankings/CTR changed).
- Tracking broke (analytics, tagging, site changes).
- Conversion rate changed (traffic same, outcomes different).
Google Trends doesn’t diagnose your site. But it helps you test the “demand dropped” hypothesis quickly.
With a previous-period overlay: You can see whether the topic’s interest is behaving similarly to the prior window. If interest is stable but your traffic is down, you shift attention to visibility (SEO, SERP changes, competitors) and measurement integrity.
Recommended companion reading (research lead from the source page): Search Engine Land’s coverage includes broader topics like changing SEO priorities for AI-driven search experiences; use these as context, not as direct evidence for your specific issue (e.g., 6 SEO priorities to rethink for AI search).
3) Competitive intel without stalking competitors
You don’t need to obsess over competitors. But you do need to understand when your category is shifting.
With overlays: If brand searches for the category leader are rising faster than the previous period while generic category terms are flat, that’s a signal: their brand awareness is growing, and your “generic-only” strategy may underperform.
This is where you might invest in:
- Brand-building content and PR
- Comparison pages (carefully written, genuinely helpful)
- Partnership pages and distribution
Note: Trend charts won’t tell you why a competitor’s brand interest is up. They just tell you it’s worth investigating.
4) Budget timing: paid search, promotions, and inventory
Even though this is an editorial about an analytics feature, the implications spill into paid media and operations:
- If demand is rising earlier than last period, you may want to pull forward promo planning and landing page updates.
- If demand is tracking lower than last period, you may hold budgets and focus on conversion improvements.
The source page also points to paid search coverage like Google tests AI-generated summaries in Search ads and other ad tactics—useful reminders that the SERP itself evolves and can change click behavior even when demand is stable.
5) Content refresh prioritization (what to update first)
SMEs are usually sitting on a backlog of content that is “mostly fine” but aging: old screenshots, outdated stats, missing FAQs, thin product explanations.
With overlays: When a topic begins to rise compared to the previous period, you can refresh earlier—before rankings and conversions take a hit. It’s a small workflow change that often compounds into a measurable advantage.
A practical workflow: from Trends insight to approved execution
Here’s the part most businesses miss: analysis doesn’t create outcomes. Execution does.
A clean workflow makes this feature valuable. A messy workflow turns it into “another chart we looked at once.”
Step 1: Create a “demand watchlist”
Pick a list of terms/topics that map to revenue, not curiosity. For most SMEs, start with:
- Top 5 services
- Top 10 product categories
- Top 10 problem/solution queries you convert on
Step 2: Standardize two comparisons
Don’t let every meeting choose a new comparison window. Choose two, consistently:
- Previous period (e.g., last 30 days vs the 30 days before) for pace and momentum.
- Year-over-year when seasonality is strong (e.g., this month vs same month last year).
Google Trends now makes the first comparison faster. For YoY, you may still adjust windows based on what you’re analyzing.
Step 3: Decide which “bucket” the change belongs to
When the line diverges, you’re in one of these buckets:
- Seasonality (normal): stay the course; publish/refresh on schedule.
- Demand shift (market): new pages, new offers, new positioning.
- Visibility shift (SEO/SERP): fix technical issues, improve content depth, adjust internal links, clarify intent.
- Measurement shift: audit GA4/GSC setup, tag changes, site releases.
Step 4: Translate into an execution queue (not a slide deck)
This is where AYSA fits naturally. The highest-performing teams don’t just “note insights.” They create tasks tied to real site changes.
Inside an execution system, those tasks look like:
- Create or refresh a landing page
- Add missing FAQ sections (and structure them cleanly)
- Improve internal linking from high-authority pages
- Fix metadata for CTR alignment
- Address technical issues affecting crawl/indexing
AYSA’s core value is that it can monitor, prepare changes, ask for approval, and execute accepted updates—so your organization doesn’t stall between “we should” and “we did.” Learn more about AYSA monitoring at AYSA Monitoring.
Step 5: Validate with first-party data
Google Trends is a market lens. Your business needs first-party validation:
- Google Search Console: impressions and clicks by query/page (visibility and demand interplay).
- GA4: landing page sessions, engagement, conversions (business outcomes).
Then you make the decision that most businesses avoid: either ship the changes or explicitly choose not to—and document why.
SME scenario: a local clinic that thinks demand is down (but it’s not)
Let’s take a realistic example: a regional allergy and asthma clinic.
The situation: In early spring, they notice organic traffic is down 18% month-over-month. The office manager is worried, and the owner assumes “Google changed something again.” The agency proposes a big technical audit. The clinic considers increasing Google Ads spend.
What a quick Trends overlay can clarify:
- They check “allergy testing” and “seasonal allergies” in their area.
- The overlay shows that interest is also down compared to the previous period—because that period included a short spike from a local weather change and a high-pollen week.
- Year-over-year, interest is tracking roughly normal for this point in the season.
Interpretation: Demand is behaving normally; the prior period was unusually high. That doesn’t mean the clinic should do nothing—but it changes the urgency and the next steps.
A good response:
- Update their key service pages with clearer “when to come in” guidance and add FAQ sections.
- Publish one timely guide: “How to tell a cold vs allergies this season.”
- Strengthen internal linking from the homepage and location pages to allergy-related services.
- Monitor impressions and CTR in Search Console weekly.
Where AYSA fits: AYSA helps convert this into a controlled set of website changes, queued for approval, then executed—so the clinic doesn’t lose weeks to back-and-forth or half-finished tasks. For how we think about AI-era visibility broadly, see AI Search Visibility.
What agencies should rethink: reporting, pacing, and proactive strategy
If you run an agency (or you’re an in-house marketer acting like one), this Google Trends improvement is a small gift: it’s a faster way to show context and reduce misinterpretation.
Reporting: stop defending, start explaining
Clients rarely want to hear about “indexing,” “core updates,” or “SERP volatility” as a first explanation. They want to know:
- Did demand change?
- Did our visibility change?
- Did outcomes change?
- What are we doing next?
Trend overlays make that first question easier to answer quickly, which prevents defensive reporting and makes room for strategy.
Pacing: align deliverables to demand windows
Agencies often deliver on monthly cycles. Demand doesn’t care about your invoicing schedule.
If your clients’ categories are seasonal, you should move on a demand calendar:
- Refresh pages before the ramp
- Publish guides before the spike
- Build internal links while interest is rising
Trend comparisons can support this pacing change without creating a heavy analytics burden.
Execution: the bottleneck isn’t ideas—it’s approvals
In the real world, the bottleneck is often:
- Waiting for a stakeholder to approve copy
- Waiting for dev resources
- Waiting for “one more review”
AYSA’s “prepare → approve → execute” model is designed for this reality. If you want to see the tool ecosystem angle, start at AI SEO Tools and then explore how monitoring supports ongoing decisions at AYSA Monitoring.
How this connects to AI search visibility (AEO/GEO) without overhyping it
Google Trends is not an “AI search” product. But the way people discover information is changing, and the competitive environment is noisier. That means you need better demand interpretation and faster execution.
From the broader Search Engine Land context on the source page, you can see the industry’s attention shifting toward AI-driven discovery and new measurement approaches (for example, topics like prompt-level visibility and the evolving SEO tool stack: The new SEO stack).
Here’s the grounded connection:
- AI-driven answers can change click patterns even when demand is stable. Trend overlays help you isolate “demand stable” faster so you can look at CTR/visibility next.
- Topic authority matters more when answers are synthesized. If demand for a topic is rising earlier than expected, you want your best page to be the one AI systems and search results see as complete and trustworthy.
- Execution speed becomes a differentiator. If you spot the ramp but publish after the peak, you lose the upside—classic search or AI surfaces.
AYSA is built for that execution loop: monitor what’s changing, propose site and content updates, request approvals, and execute accepted changes. It’s the difference between “we noticed” and “we shipped.”
What can go wrong: the common traps when interpreting Trends
Trends is powerful, but it’s easy to misuse. Here are the traps I see most often—and what to do instead.
Trap 1: Treating a Trends index like exact volume
A higher line doesn’t necessarily mean “double the searches.” It means higher relative interest in the selected context.
Instead: Use Trends for directionality, then validate in Search Console impressions and your own revenue/conversion data.
Trap 2: Comparing the wrong periods
“Previous 30 days” is convenient, but not always meaningful. If a holiday or major event was in one window, your comparison will lie to you.
Instead: For seasonal categories, default to YoY plus previous-period. Use both to triangulate.
Trap 3: Using too-broad terms that hide intent shifts
Broad terms can mask what’s happening underneath. “Shoes” might be flat, while “wide toe box running shoes” is rising.
Instead: Build a topic cluster watchlist: head term + 5–15 high-intent modifiers.
Trap 4: Ignoring geography
National trends can mislead local businesses.
Instead: Use geo filters where appropriate, then validate with local performance pages in Search Console.
Trap 5: Thinking insights equal outcomes
The most common failure mode: everyone agrees on the chart, but nothing gets published, updated, or fixed.
Instead: Put the insight into an execution system with approvals. That’s exactly the gap AYSA is designed to close.
A 30-day action plan for SMEs
If you’re a small or mid-sized business, you don’t need a “data transformation program” to benefit from this. You need a tight operating rhythm.
Week 1: Build your watchlist and baseline
- List your 20 highest-value topics (services/products/problems).
- Check each in Google Trends and use the previous-period overlay.
- Label each topic: seasonal, steady, volatile, or event-driven.
Week 2: Map topics to pages (and find gaps)
- For each topic, identify your primary landing page.
- If you don’t have a page, that’s a content gap.
- If you have multiple pages competing, you likely need consolidation or clearer intent alignment.
Week 3: Create an execution queue (refreshes first)
- Prioritize updating existing pages that already get impressions.
- Make improvements that help both humans and machine understanding: clearer structure, better FAQs, stronger internal links, cleaner page purpose.
Week 4: Monitor and iterate
- Track Search Console impressions and clicks for the watchlist topics/pages.
- Compare performance to the same week last period where possible.
- Keep publishing or refreshing based on what’s rising earlier than expected.
If you want an execution partner that can help you manage this loop with approvals and controlled changes, review AYSA plans at AYSA Pricing.
The AYSA perspective: analytics is only useful when it ships
One reason I’m paying attention to a “small” Google Trends UI change is that it reflects a bigger theme: the best teams reduce friction between seeing and doing.
Here’s how we think about that at AYSA.ai:
- Monitor: Keep an always-on view of visibility and demand signals so you’re not surprised.
- Prepare: Turn signals into concrete recommendations—pages to update, content to add, internal links to create, technical fixes to apply.
- Approve: Put humans in control of changes with an approval workflow.
- Execute: Ship accepted changes quickly, consistently, and safely.
That’s the heart of what we do—and it’s why analytics improvements matter. If you want more editorial thinking like this, see the AYSA blog at AYSA Blog.
What to do next
- Open Google Trends and build a 20-topic revenue watchlist.
- Use the previous-period overlay to label each topic: normal seasonal, rising early, falling early, or volatile.
- Validate the story in Google Search Console: are impressions moving similarly?
- Create an execution queue: refresh the pages tied to topics rising earlier than expected.
- Operationalize the loop with monitoring + approvals so actions actually ship (see AYSA Monitoring and AI Search Visibility).
Sources and further reading
- Search Engine Land: Google Trends adds previous time period comparison
- Search Engine Land: The new SEO stack: What replaces your old toolset
- Search Engine Land: 6 SEO priorities to rethink for AI search
- Search Engine Land: How to measure prompt-level visibility in AI search
- Search Engine Land: Google tests AI-generated summaries in Search ads
- AYSA.ai: AI SEO tools
- AYSA.ai: AI search visibility
- AYSA.ai: Monitoring
- AYSA.ai: Pricing
- AYSA.ai: Blog
Continue the AI search topic inside AYSA.
Use these pages to connect the article with AI SEO tools, AI visibility monitoring, AI Overviews and approved website execution.
Turn this topic into a website action plan.
Use these AYSA hubs to move from reading to technical fixes, AI visibility monitoring, research, glossary context and approval-first SEO execution.