
Your PageSpeed Score Went Up (But Your Site Didn’t): What Lighthouse 13.6 Really Changed—and How To Respond
Google updated Lighthouse inside PageSpeed Insights, changing the way lab tests simulate loading. Many sites—especially JavaScript-heavy ones—may see higher scores without any real-world improvement. Here’s what changed, what it means for SMEs and agencies, and how to build an execution-ready performance program that doesn’t chase vanity scores.
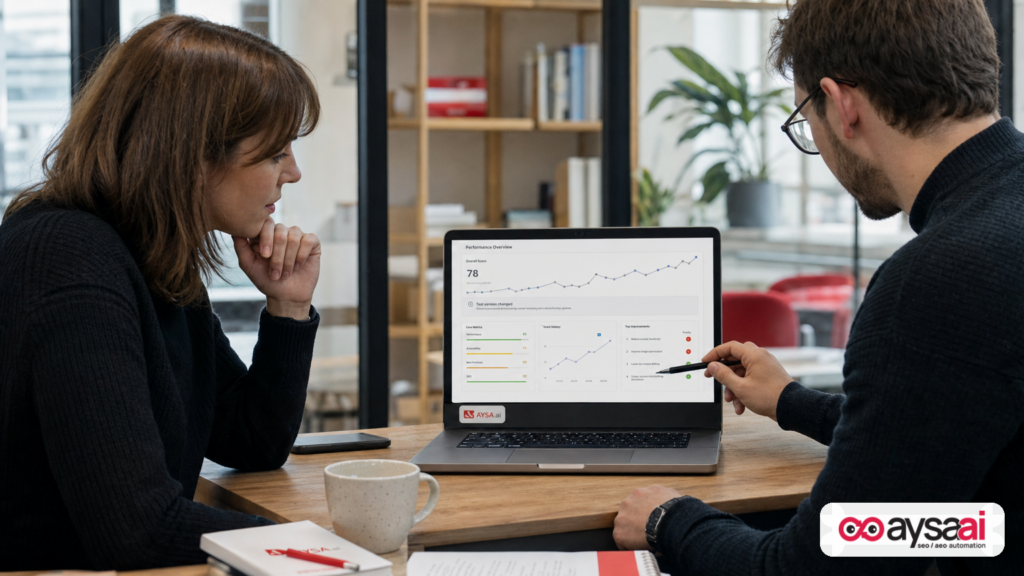
PageSpeed Insights scores are about to become even more confusing for busy operators.
Google has updated the Lighthouse version that powers PageSpeed Insights’ lab tests. The update changes how Lighthouse simulates loading under slower conditions—and Google’s own performance advocate Barry Pollard has indicated that the new simulation tends to produce more accurate (and often higher) simulated First Contentful Paint (FCP) and Largest Contentful Paint (LCP), especially for JavaScript-heavy sites.
That means your score can jump even if your site didn’t improve. And if you don’t notice the version change, you can end up celebrating (or billing, or re-prioritizing) a “win” that’s mostly a measurement change.
This editorial is the playbook: what changed, why it matters for real businesses, how to keep reporting honest, and how to run performance work as an execution system—not a one-off audit.
Concise summary

- What happened: PageSpeed Insights now runs a newer Lighthouse (13.6.0 per Search Engine Journal’s reporting), which updates the “Lantern” simulation used to estimate loading under throttled conditions.
- What you’ll see: Some sites—particularly JavaScript-heavy experiences (SPAs, app-like storefronts, interactive marketing sites)—may see higher lab scores without making changes.
- What to do: Before claiming improvement, verify Lighthouse version, compare field data (CrUX in PSI), and tie performance work to business outcomes (leads, checkout completion, calls, bookings).
- How AYSA fits: Performance should be operational: monitor changes, prepare recommendations, request approval, then execute accepted changes safely—especially when the measurement system itself changes.
Table of contents

- Why this is happening now (and why so many teams will miss it)
- What actually changed in Lighthouse 13.6 (in plain English)
- Why JavaScript-heavy sites are more affected
- Lab data vs field data: the difference that keeps businesses honest
- How performance reporting breaks when the test changes
- What to check inside PageSpeed Insights before you celebrate
- A concrete SME scenario: the Shopify-like store with a JavaScript-heavy theme
- What can go wrong if you chase the new score
- How SMEs and agencies should adapt their performance program
- The AYSA way: monitoring + approved execution (not one-off audits)
- What to do next (action list)
- Sources and further reading
Why this is happening now (and why so many teams will miss it)

If you’re an operator—founder, marketing lead, ecommerce manager, or agency account owner—your workflow is predictable:
- You run PageSpeed Insights before a sprint.
- You ship changes (or at least you think you did).
- You run PageSpeed Insights again and compare the score.
That’s normal. It’s also fragile, because PageSpeed Insights isn’t a single unchanging “test.” It’s a product that depends on Lighthouse, which evolves continuously.
Per Search Engine Journal’s coverage, PageSpeed Insights has updated to Lighthouse 13.6.0, and that update changes how the tool simulates page loading. According to Chrome Web Performance Developer Advocate Barry Pollard (as cited in the SEJ piece), the resulting simulated metrics—especially FCP and LCP—are now more accurate than before and will often come out better. In other words: scores may rise on pages that haven’t changed.
This is not a scandal. It’s actually what we want: better measurement models over time. But it is a management problem, because:
- Most dashboards don’t annotate “measurement model changed.”
- Most performance reporting doesn’t mention the Lighthouse version.
- Most business stakeholders only see the headline number.
So the risk isn’t Lighthouse improving. The risk is teams making business decisions on top of a number that changed for reasons they didn’t control.
What actually changed in Lighthouse 13.6 (in plain English)
Let’s translate the technical updates into business reality.
PageSpeed Insights lab data comes from running Lighthouse in a controlled environment, then applying a simulation system (Lantern) to estimate how the page would load under slower device/network conditions. According to SEJ’s summary of the Lighthouse 13.6 release notes, two simulation changes matter most for the metrics that drive your score:
1) Better identification of what truly blocks rendering
Previously, Lighthouse’s simulation leaned more on each request’s “fetch priority” to decide whether it should be treated as render-blocking. In 13.6, Lantern is now using Chrome’s own render-blocking label when available, and only falls back to priority when that label is missing (per the SEJ article’s description of the release notes).
Why this matters: Many modern sites load dozens (or hundreds) of resources—scripts, styles, images, fonts, third-party tags. Whether a resource truly blocks the first paint is not always obvious. If the simulation model is more aligned with how Chrome actually treats those resources, the model can stop “punishing” pages for requests that aren’t truly on the critical path.
How this shows up in your score: Simulated FCP and LCP can improve without any code changes because the model is classifying some work differently.
2) Text LCP that appears with the first content is now modeled more sanely
The SEJ article highlights an important edge case: when the LCP element is text that appears in the same frame as the first content, Lighthouse 13.6 estimates LCP using the same requests and tasks it uses for FCP (rather than including a broader set of all requests made before LCP).
Why this matters: If your page’s above-the-fold content is mostly text (common on product listing pages, category pages, landing pages, and content sites), FCP and LCP are often close together in real life. But the old simulation could produce an LCP that looked far later than FCP, creating a misleading narrative: “your LCP is slow, so your above-the-fold content is slow,” even when real users didn’t experience it that way.
Business translation: The new model may stop flagging “fake slow LCP” problems that were artifacts of the simulation rather than genuine user pain.
Also notable: the ARD audit behavior changed
Lighthouse 13.6 also updates how the Agentic Resource Discovery (ARD) audit checks for discovery files and signals, including looking for /.well-known/ard.json and related references before older “ai-catalog” names (as summarized by SEJ).
If you’re an SME, you might not care today. But the direction is clear: the toolchain is expanding beyond classic performance into how sites communicate with AI/agentic systems.
If you’re building for AI Search visibility long-term, you should expect more of these audits. (This is exactly why we treat Technical SEO as a living system, not a one-time project.)
Why JavaScript-heavy sites are more affected
Barry Pollard’s comment (as referenced by SEJ) points to a practical pattern: JavaScript-heavy sites are more likely to see meaningful score changes from this update.
That should not be controversial. JavaScript-heavy experiences have:
- More requests.
- More main-thread work (parsing, compiling, executing).
- More opportunities for the simulator to misjudge what’s blocking paint vs what’s “just happening.”
So when the simulation model improves, it disproportionately benefits pages where the old model was most likely to overestimate blocking behavior or misattribute delays.
Important nuance: This does not mean JavaScript-heavy sites suddenly got faster for users. It means the lab test got better at approximating reality. For some sites, that will move lab metrics closer to field metrics. For others, it may create a new mismatch in the opposite direction. Your job is to measure, not assume.
Lab data vs field data: the difference that keeps businesses honest
PageSpeed Insights shows both lab data and field data in one report, which is helpful—if you understand what you’re looking at.
SEJ’s article references Google’s own PageSpeed Insights documentation distinction:
- Lab data = simulated results from a controlled run, with a single device and fixed network conditions. Great for debugging and repeatable tests.
- Field data = aggregated real user experience over the last 28 days (via the Chrome User Experience Report, CrUX). Great for understanding what customers are actually experiencing at scale.
Here’s the practical rule I use when advising SMEs:
- If lab improves and field improves, you likely shipped a real win.
- If lab improves and field is flat, you may have improved only in the lab—or the change hasn’t rolled into the 28-day field window yet.
- If lab improves and field worsens, stop celebrating and investigate immediately.
And here’s the uncomfortable truth: stakeholders often want a single KPI. But performance doesn’t collapse cleanly into one number.
So what should you anchor on?
- Field performance as the reality check (because customers are the point).
- Lab performance as the diagnostic tool (because you need something repeatable while you work).
- Business outcomes as the decision-maker (because that’s why you’re investing in performance in the first place).
How performance reporting breaks when the test changes
Most organizations—especially SMEs—don’t have a mature performance engineering function. They have “someone who runs PageSpeed” and maybe a developer who helps when the scores are low.
That’s why a Lighthouse update can quietly break reporting in four predictable ways:
1) False attribution: your team takes credit for Google’s model improvement
You ran PSI last month, got a 62. You run it today, get a 78. You just shipped… nothing.
If you don’t notice the Lighthouse version changed, you’ll attribute the improvement to “ongoing optimizations,” and you’ll reinforce the wrong behavior: chasing the score rather than shipping measured improvements.
2) Misleading vendor evaluation
If you hired an agency or developer and you’re paying for performance improvements, version shifts can create the appearance of results that didn’t come from their work—or conceal the lack of results behind noise.
Better practice: performance engagements should define how wins are measured (versioned lab comparisons + field trend + business KPI impact).
3) Broken historical charts
Many teams track PSI scores over time in a spreadsheet or a BI tool. When the underlying model changes, your chart shows a jump—then leadership asks “what changed?”
Without annotation (Lighthouse 13.6 release), you end up with storytelling instead of analysis.
4) Wrong backlog priorities
If scores jump, teams may deprioritize performance work (“looks good now”) even if real users are still struggling. Or teams may over-prioritize micro-optimizations to push a score from 92 to 96 while ignoring conversion killers like slow add-to-cart, delayed interactivity, or flaky third-party scripts.
What to check inside PageSpeed Insights before you celebrate
Here is the practical checklist I want every operator to use when a PSI score changes meaningfully (up or down) without an obvious release.
1) Check the Lighthouse version in the report
PageSpeed Insights includes the Lighthouse version used to generate the lab report (SEJ notes it appears next to the emulated device). This matters now more than ever.
Operational rule: Never compare lab scores across different Lighthouse versions without labeling the comparison as “not apples-to-apples.”
2) Compare field data for the same URL pattern
Field data in PSI is aggregated over 28 days, which means it moves slowly. But it’s your best check against simulation artifacts.
What to look for:
- Is field LCP trending in the same direction as lab LCP?
- Are field issues concentrated on mobile?
- Is field data missing (low traffic)? If yes, you must measure with other methods and be careful with conclusions.
3) Look beyond the single score: FCP, LCP, and the narrative
The SEJ piece focuses on simulated FCP and simulated LCP improvements. That’s important because those metrics strongly influence the headline performance score.
Better habit: When you report performance, report the underlying metrics and what caused them—not just the score.
4) Use tool updates as a trigger to tighten your process
If your team has any kind of performance SLA (even informal), updates like Lighthouse 13.6 are your reminder to standardize reporting:
- Store the Lighthouse version with each recorded test.
- Store the test date/time and URL.
- Store what changed on the site that week (release notes, deployments).
This is basic operational hygiene—and it’s shockingly rare.
A concrete SME scenario: the Shopify-like store with a JavaScript-heavy theme
Let’s make this painfully real.
Imagine an ecommerce brand doing $1–5M/year. They run a modern theme that’s app-like: quick views, filters, animations, personalization, reviews, loyalty widget, post-purchase upsells—lots of JavaScript.
The team has been stressed about mobile speed. Their agency sends monthly reports with PSI scores. Leadership has one question: “Are we improving?”
What the team sees after the Lighthouse update
- Mobile PSI score rises from 58 to 71 on key templates (home, collection, product).
- No release happened. No theme update. No tag removal. No new caching.
Everyone wants to say: “Great! We fixed performance.”
What might actually be true
- The old lab simulation was overstating render-blocking behavior for this particular stack.
- The new simulation aligns better to how Chrome processes blocking labels and text-based LCP cases.
- The new score may be more accurate—but not necessarily better in reality.
What the business should do instead of celebrating
- Confirm the Lighthouse version changed between tests.
- Check PSI field data: did 28-day mobile LCP distribution improve?
- Check business KPIs: did Conversion rate, add-to-cart rate, and checkout completion improve? (No invented numbers—use your own analytics.)
- Decide: are you done, or do you still have performance debt that impacts revenue?
Most SMEs stop at the score. Mature teams continue to the customer.
What can go wrong if you chase the new score
Performance work is full of second-order effects. A scoring model shift can tempt teams to make changes they can’t safely validate.
1) You optimize for the lab, not for customers
If a model change pushes your score upward, the temptation is to “finish the job” by tuning for Lighthouse rather than user experience. That often leads to:
- Aggressive deferral of scripts that breaks functionality.
- Overzealous image Compression that hurts product clarity (bad for ecommerce).
- Unintended layout shifts from font swapping or CSS changes.
Some of these changes might raise the score and hurt the business.
2) You get overconfident and reduce monitoring
Teams see a higher score and conclude “we’re fine now.” Then third-party tags creep back in, new apps get installed, and performance silently regresses—until revenue dips or rankings soften.
3) You break analytics and can’t prove anything
A common performance “fix” is to remove or delay tags. If you do that without guardrails, you can break measurement and end up in a dark room where nobody can prove whether performance work helped or hurt.
4) You damage trust with clients or leadership
If you’re an agency and you claim credit for a score jump that came from a Lighthouse update, you risk credibility. Not because you’re dishonest, but because you didn’t control for the measurement system.
Trust in performance work is fragile. Protect it with version-aware reporting.
How SMEs and agencies should adapt their performance program
The right response to Lighthouse 13.6 isn’t panic. It’s maturity.
1) Set a new baseline after toolchain changes
When a major measurement model shifts, re-baseline your lab performance benchmarks:
- Run a consistent set of URLs (home, category, product/service, lead form, blog article).
- Record Lighthouse version, device profile, and test date.
- Store results as the “post-update baseline.”
This prevents you from comparing against an obsolete yardstick.
2) Report underlying metrics, not just the score
Operators need narrative, not numerology. When you report performance improvements, include:
- Simulated FCP/LCP trends (lab).
- CrUX trends when available (field).
- What changed on the site (deployments, tag changes, theme changes).
- What changed in the toolchain (Lighthouse version updates).
3) Tie performance work to business outcomes
Performance is not an aesthetic metric. It’s a revenue and customer-experience lever.
Depending on your business type, your “performance success” KPI might be:
- Ecommerce: add-to-cart rate, checkout completion, revenue per session.
- Local services: call Clicks, form submissions, booking starts.
- SaaS: demo requests, trial signups, pricing-page engagement.
- Publishers: engaged time, newsletter signups, ad viewability (careful: ads also slow sites).
You don’t need invented benchmarks. You need consistent measurement in your own analytics.
4) Separate diagnostic tooling from acceptance criteria
Lighthouse is an excellent diagnostic tool. But acceptance criteria for “done” should be broader:
- Field trends.
- Error rates.
- Conversion funnel health.
- Search performance (impressions, clicks) in Google Search Console, when relevant.
If you’re only using PSI scores, you’re treating a thermometer as the patient.
5) Expect more AI/agentic audits inside the same toolchain
The ARD audit update in Lighthouse 13.6 is a subtle signal. The same ecosystem that measures performance is also starting to measure “AI readiness” signals (discovery manifests, machine consumption patterns).
If your SEO strategy includes visibility in AI-driven experiences, treat this as early-warning: technical SEO is expanding. Monitor it continuously.
The AYSA way: monitoring + approved execution (not one-off audits)
Most businesses don’t fail at performance because they don’t know what to do. They fail because they can’t execute consistently without risk.
That’s why we built AYSA as an execution system, not a PDF generator.
1) Monitoring: detect changes you didn’t make (and changes Google did)
Lighthouse 13.6 is a perfect example of why monitoring matters. When your score moves, you need to know whether it was:
- a code change you shipped,
- a third-party script that got heavier,
- or a measurement model update.
AYSA is built to support ongoing monitoring workflows so teams can stop reacting and start managing. Learn more: AYSA Monitoring.
2) Prepare: turn findings into a prioritized, business-readable plan
Performance recommendations fail when they’re not framed in business terms. “Reduce unused JS” is not a plan. A plan is:
- what to change,
- where to change it,
- what risk it introduces,
- what success looks like (lab + field + KPI),
- and what to test after.
This is the difference between technical SEO theatre and operational performance improvement.
3) Ask for approval: protect the site while moving fast
SMEs have a real constraint: limited engineering time and low tolerance for breaking revenue-critical pages.
AYSA is designed to ask for approval before executing changes. That matters because performance optimizations often touch sensitive areas:
- tag managers,
- script loading,
- themes/templates,
- caching headers,
- CDN configuration.
Approved execution is how you keep performance work safe.
4) Execute: ship improvements, then verify with the right evidence
The win isn’t “score went up.” The win is:
- customers get content faster,
- your funnel works smoothly on mobile,
- and you can prove it with field data and outcomes.
If you want the broader strategic frame—how performance and technical readiness connect to AI search visibility—start here: AI Search Visibility.
Where to explore AYSA capabilities
- AI SEO tools: AI SEO Tools
- Monitoring: AYSA Monitoring
- Pricing (so you can evaluate fit quickly): AYSA Pricing
- More editorials and playbooks: AYSA Blog
What to do next (action list)
- Audit your own reporting: Do your performance snapshots record the Lighthouse version? If not, fix that this week.
- Re-baseline key templates: Home, money pages, lead forms, blog/article template. Save “post-13.6 baseline” results as a new starting line.
- Separate lab and field statements: In every report, label what’s lab (simulated) vs field (real users).
- Stop reporting one number: Include FCP, LCP, and a short explanation of what changed.
- Validate with business KPIs: Pick one KPI per template (e.g., product page → add-to-cart) and watch it alongside performance changes.
- Create a “third-party tag budget”: Track new scripts/apps as part of performance governance. Many regressions come from marketing tools, not dev releases.
- Use an execution system: Monitoring + prioritized recommendations + approval + safe execution. That’s how you avoid endless audits with no shipping.
Sources and further reading
- Search Engine Journal: PageSpeed Insights Scores May Rise After Lighthouse Update (primary reporting used for this editorial)
- SEJ: Technical SEO section (context and ongoing coverage)
- SEJ: SEO section (broader SEO context)
- SEJ: Google updates history (helpful background for non-SEO stakeholders)
Note: This editorial relies on the supplied research context from Search Engine Journal and does not claim to have independently reviewed Lighthouse release notes or Google documentation beyond what is included in that context. If your organization needs strict technical verification, confirm details directly in Lighthouse release notes and PageSpeed Insights documentation before formalizing SLAs.
Continue the AI search topic inside AYSA.
Use these pages to connect the article with AI SEO tools, AI visibility monitoring, AI Overviews and approved website execution.
Turn this topic into a website action plan.
Use these AYSA hubs to move from reading to technical fixes, AI visibility monitoring, research, glossary context and approval-first SEO execution.